EQx is a Political Economy
Global Index
The Index ranks the world’s countries by Elite Quality. Elite Power – i.e. the ability of elites to set up extractive business models in the future – as well as actual Value Creation vs Extraction in the Economic and Political dimensions, are measured on the basis of dozens of Indicators.
How is the Index Structured ?
The Index is based on a 4-level architecture allowing for both an overall quantification of a country’s EQx, as well as an in-depth analysis of specific political economy dimensions.
EQx Levels in Depth
Explore each level, its logic and components.
Index
Level 1

Elite Quality Index (EQx)
What is the concept behind our Index?
Let’s assume that elite`s business models are key determinants of a nation’s future prosperity and human welfare. In any political economy, there are essentially two kinds of business models; on one hand, Value Creation models like new biotech drugs developed by innovative pharma or start-ups. On the other, Value Exraction models and rent seeking models, such as monopolies or trade barriers that result in higher prices. In 2019, Martin Wolf, Chief Economist of the Financial Times, suggested in a memorable FT article that even in liberal democracies there might be plenty of rent seeking models by “rentier capitalists”.
The EQx Index aims to operationalize political economy concepts by equating them to actual levels of Value Creation and Rent Seeking.
Sub-Indices and Index Areas
Level 2

Power

Value
The Index can be divided in 2 Sub-Indices: Power and Value. Power is seen as a necessary condition for Value Extraction and rent seeking since Value Extraction business models require Power to operate. The Power Sub-Index I is thus the indicator of potential future Value Extraction.
Both Sub-Indices in turn include a Political and an Economic Dimension. This yields 4 Index Areas: on the Power Sub-Index, Political Power (i) and Economic Power (ii); on the Value Sub-Index, Political Value (iii) and Economic Value (iv).
Power Sub-Index I
Power refers to the elite’s capacity to enforce their preferences on the political economy; Power is thus an Indicator of potential future Value Extraction.
Economic Power (ii)
Measure elite dominance in the economy: at the firm level, at the industry level, and in terms of creative destruction.
Political Power (i)
Measures the capture
of 3 kinds of rules:
rules of the state,
business regulations,
and the rules of human labor.
Value Sub-Index II
Value Creation sees outputs more valuable than inputs. Elite business models are somewhere in the range between Value Creation, at one extreme, and Value Extraction/Rent Seeking on the other.
Economic Value (iv)
Measures Value Extraction from the economy's 3 markets: products and services, capital markets, and labor markets.
Political Value (iii)
Measures Value in the political dimension: as the state's unearned income, its taking of income, and its giving of income.
Pillars
Level 3
The 12 EQx Pillars each capture a specific element of the Economic and Political Power/Value complex present in our countries. The purpose of the Pillars is to define and form conceptual lenses through which we can approach, understand and measure specific phenomena. They comprise a weighted sum of expertly chosen Indicators which numerically evidence present or future potential Value Creation or rent seeking.
Each Pillar is conceptually consistent with one of the four Index Areas. Each of the 3 Pillars forming an Index Area has been assigned its own weight within its Index Area.
Political Power (i)

State Capture (i.1)

Regulatory Capture (i.2)

Human Capture (i.3)
Economic Power (ii)

Industry Dominance (ii.4)

Firm Dominance (ii.5)

Creative Destruction (ii.6)
Political Value (iii)

Giving Income (iii.7)

Taking Income (iii.8)

Unearned Incomen (iii.9)
Economic Value (iv)

Producer Rent (iv. 10)

Capital Rent (iv.11.)

Labor Rent (iv.12)
Political Power Pillars
Measure the capture of three kinds of rules:
The rules of the state, the rules of business regulation, and the rules for labor markets and civil service jobs

State Capture
Pillar i.1, State Capture focuses on the direct capture by distributional coalitions of the state and its government branches. This Pillar measures diverse manifestations of elite power ranging from political centralization to gender parity at the state’s top echelons. Specific Indicators measure Social Mobility (MOB, i.1) and any evidence that the state has been captured, as for instance evidenced by Political corruption (COR, i.1).

Regulatory Capture
Pillar i.2, Regulatory Capture measures the extent to which rules and regulation, or the making thereof, have been captured by special interests. The Pillar includes Administrative decentralization (AED, i.2) and Crony capitalism (CRO, i.2), derived from an index proposed by The Economist1, which measures wealth derived by billionaires from rent-heavy industries as a signal of the successful capture of regulators or legislators. It also incorporates the World Bank’s widely-recognized Ease of Doing Business Index which measures the quality of a country’s institutions and regulatory environment.

Human Capture
Pillar i.3, Human Capture attempts to measure the power of labor and civil service coalitions, including their privileges in the political system. This might be reflected by their ability to influence their own wages and working conditions. In this Pillar, evidence of their Political Power is measured by Unionization rates (UNI, i.3), or Public sector employees as % of total employment (PSE, i.3). Other areas of human capture are operationalized by the Women, Business and the Law (WBL, i.3) Indicator, or the extreme phenomena of modern slavery by the Global Slavery Index (GSI, i.3).
Economic Power Pillars
Measure elite dominance in the economy:
First at the industry level, then at the single business level, and lastly, the opposite of dominance, i.e. creative destruction.

Industry Dominance
Pillar ii.4, Industry Dominance
measures a national economy’s diversity. Influence of a
country’s dominant industries in the political economy is assessed by Indicators measuring, for instance, the relative export volumes, revenues, or profits of leading industries as percentage of GDP. The Pillar also includes Indicators like the Economic Complexity Index
(ECI, ii.4) measuring the “amount of productive knowledge”2
implied in a country’s export structures.

Firm Dominance
Pillar ii.5, Firm Dominance measures the degree of power concentration in the hands of a nation’s leading firms. To that effect, the Pillar examines, for instance, the Top 10 firms market capitalization as % of GDP (FKG, ii.5), as well as the number of Small and medium – sized enterprises per 1,000 people (SME, ii.5). Indicators further considered will be measurements of policies designed to maintain healthy levels of competition and limits to Economic Power.

Creative Destruction
Pillar ii.6, Creative Destruction estimates the pressures for renewal and disruption in an economy. Borrowing Schumpeter’s concept3, one focus is entrepreneurs whose role is to challenge incumbents and drive economic growth. The Pillar first considers the“destruction” part of the process for instance by measuring the Listed firms turnover, long run 15 years / short run 3 years (TUL/TUS, ii.6) and the Firm entry/exit ratio (ENR/EXR, ii.6). Then, it considers the forces fostering “creation” in the economy, such as the all-important level Entrepreneurship (ENT, ii.6) or VC (venture capital) finance (VCK, ii.6).
Political Value Pillars
Political rent is conceptualized as the state’s unearned income, as well as the state’s taking and giving of income.

Giving Income
Pillar iii.7, Giving Income focuses on how the government uses and manages public finances. Redistribution of state income in the form of Subsidies and transfers as % of expenses (SNT, iii.7) is an important Indicator of this Pillar; many of these processes often divert resources away from most efficient uses and create hidden cost 4. The Pillar also evaluates Indicators conducive to Value Creation, like public education provision or health including Covid-19 safety (COV, iii.7), that increase competition in many markets and act to curb rent seeking behaviors.

Taking Income

Unearned Income
Pillar iii.9, Unearned Income mainly focuses on the exploitation or Value Extraction of natural and various resources, including the future. For instance, environmental footprints are conceptualized as wealth provided by nature – i.e. wealth that is not earned in full. In addition, low Environmental Performance Index (EPI, iii.9) represents intergenerational wealth transfers, as does Government debt as % of GDP (DBT, iii.9). State ownership,
control and involvement in business (SOE, iii.9) is another Indicator here – the license to operate is self – issued rather than earned.
Economic Value Pillars
Measure the Value Creation vs. Extraction in the economy’s 3 markets:
The products and services market, the capital market and the labor market.

Producer Rents
Pillar iv.10, Producer Rent identifies rents extracted by producers and suppliers in the market for goods and services. Rents are extracted, for example, through barriers as implied in Trade Freedom (TRF, iv.10), Barriers to entry (BTE, iv.10) or Foreign direct investment as % of GDP (FDI, iv.10). Protectionist measures against entry enable Value transferring business models to be established, usually to the benefit of domestic producers and investors, inducing welfare losses well-documented in economics.

Capital Rents
Pillar iv.11, Capital Rent focuses on rents extracted though direct or indirect financial market participation. Data from markets, including Neutral interest rate (DNI, iv.11), M&A as % of GDP (DMA, iv.11), Gold demand as % of GDP (GOL, iv.11) or Currency appreciation (CUA, iv.11), are assessed to determine Value Extraction. More complex forms of rent seeking in capital markets will also be considered in the future, like the difference between return on assets (ROA) and total factor productivity (TFP).

Labor Rents
Pillar iv.12, Labor Rent seeks to determine all rents arising from interventions in or related to labor markets by participants on both supply and demand sides. For this purpose, the Pillar will include the Unemployment rate (UEM, iv.12) and other measures which often are the result of intra-labor rent seeking. Value Extraction phenomena in which rent seeking can a priori occur on either the employers or employee side are also measured, like the Delta real wage vs labor productivity (WLP, iv.12). More clear-cut Value Extraction models considered are the Gender wage gap (GWG, iv.12) and the planned Cost of Thriving Index (CTI, iv.12).
Sources
1) Comparing crony capitalism around the world. (2016, May 5). The Economist.
Retrieved from https://www.economist.com/graphic-detail/2016/05/05/comparing-crony-capitalism-around-the-world
2) Hausmann, R., Hidalgo, C., Bustos, S., Coscia, M., Chung, S., Jimenez, J.,& Yildirim, M. (2011). The Atlas of Economic Complexity: Mapping Paths to Prosperity.
Retrieved from: https://oec.world/static/pdf/atlas/AtlasOfEconomicComplexity.pdf
3) Schumpeter, J. (1942). Capitalism, Socialism and Democracy. New York: Harper & Brothers
4) Clements, B. & Parry, I. (2018, September). Subsidies: Some Work, Others Don’t. Finance & Development, 56–57.
Retrieved from: https://www.imf.org/external/pubs/ft/fandd/2018/09/pdf/what-are-subsidies-basics.pdf
Indicators
Level 4
Indicators are the underlying datasets from which the Index is constructed. The datasets are collected, conceptually validated and collated. They mainly come from renowned international organisations such as the World Bank and the IMF, the finance industry or other indices. Selected Indicators are developed by the EQx team of researchers and collaborators. Each Indicator is based on a specific dataset quantitatively capturing Power, as well as Value Creation vs. Extraction phenomena in the political economy.
The EQx2020 is based on 72 Indicators. The new incorporation, adjustment and update of Indicators, as well as the elimination of unsatisfactory datasets, is a fundamental part of the ongoing EQx research project. For details on single EQx Indicators such as the rationale behind their inclusion in the Index, please consult the EQx Indicators Table.
Level 2 - Index Area | Level 3 - Pillars | TLA | Level 4 - Variable Name |
---|---|---|---|
Political Power | i.1 State Capture | COR | Political corruption |
Political Power | i.1 State Capture | MOB | Social Mobility |
Political Power | i.1 State Capture | PDE | Political decentralization |
Political Power | i.1 State Capture | ADE | Administrative decentralization |
Political Power | i.1 State Capture | PGL | Political globalization |
Political Power | i.1 State Capture | WPI | Women Power Index |
Political Power | i.1 State Capture | GRC | Government's responsiveness to change |
Political Power | i.2 Regulatory Capture | DBI | Institutional quality |
Political Power | i.2 Regulatory Capture | CRO | Crony-capitalism |
Political Power | i.2 Regulatory Capture | EXP | Expropriation risk |
Political Power | i.2 Regulatory Capture | PMI | Protecting Minority Investors |
Political Power | i.2 Regulatory Capture | ECR | Ease to Challenge Regulations |
Political Power | i.3 Human Capture | UNI | Unionization rate |
Political Power | i.3 Human Capture | PSE | Public sector employees as % of total employment |
Political Power | i.3 Human Capture | CBC | Collective Bargaining Coverage |
Political Power | i.3 Human Capture | GSI | Global Slavery Index |
Political Power | i.3 Human Capture | WBL | Women - Business and the Law |
Economic Power | ii.4 Industry Dominance | IEE | Top 3 industries exports as % of GDP |
Economic Power | ii.4 Industry Dominance | IRE | Top 3 industries as % of GDP |
Economic Power | ii.4 Industry Dominance | ECI | Economic Complexity Index |
Economic Power | ii.4 Industry Dominance | IVA | Top 3 industries as % of VA |
Economic Power | ii.5 Firm Dominance | PRO | Top 10 firms profitability |
Economic Power | ii.5 Firm Dominance | SME | SMEs per 1 |
Economic Power | ii.5 Firm Dominance | ATX | Antitrust exemptions |
Economic Power | ii.5 Firm Dominance | BIW | Billionaires' wealth as % of GDP |
Economic Power | ii.5 Firm Dominance | FKG | Top 10 firms market cap as % of GDP |
Economic Power | ii.5 Firm Dominance | FRG | Top 3 firms revenues as % of GDP |
Economic Power | ii.5 Firm Dominance | FRR | Top 30 firms revenues as % of GDP |
Economic Power | ii.5 Firm Dominance | LIB | Lerner Index banking sector |
Economic Power | ii.6 Creative Destruction | TUL | Listed firms turnover |
Economic Power | ii.6 Creative Destruction | TUS | Listed firms turnover |
Economic Power | ii.6 Creative Destruction | ENT | Entrepreneurship |
Economic Power | ii.6 Creative Destruction | VCK | VC finance |
Economic Power | ii.6 Creative Destruction | RND | R&D % GDP |
Economic Power | ii.6 Creative Destruction | BTS | Barriers to start-ups |
Economic Power | ii.6 Creative Destruction | ENR | Firm entry ratio |
Economic Power | ii.6 Creative Destruction | EXR | Firm exit ratio |
Political Value | iii.7 Giving Income | SNT | Subsidies and transfers as % of expenses |
Political Value | iii.7 Giving Income | REG | Regional redistribution as % of government budget |
Political Value | iii.7 Giving Income | EDU | School life expectancy |
Political Value | iii.7 Giving Income | GPS | Expenditure on general public services as % of GDP (dev. fm optimum) |
Political Value | iii.7 Giving Income | GHS | Global Health Security |
Political Value | iii.7 Giving Income | COV | Covid-19 safety |
Political Value | iii.8 Taking Income | DCT | Corporate tax rate (dev. fm optimum) |
Political Value | iii.8 Taking Income | DKI | Delta capital gains tax vs income tax |
Political Value | iii.8 Taking Income | HOM | Homicide rate |
Political Value | iii.8 Taking Income | INE | Top 10% share of pre-tax national income |
Political Value | iii.8 Taking Income | FDE | Fiscal descentralization |
Political Value | iii.8 Taking Income | DTR | Tax revenue as % of GDP (dev. fm optimum) |
Political Value | iii.8 Taking Income | BRD | Battle-related deaths per 100 |
Political Value | iii.9 Unearned Income | DUT | Dutch disease propensity |
Political Value | iii.9 Unearned Income | SOE | State ownership |
Political Value | iii.9 Unearned Income | EPI | Environmental Performance Index |
Political Value | iii.9 Unearned Income | DBT | Government Debt as % of GDP |
Economic Value | iv.10 Producer Rent | BTE | Barriers to entry |
Economic Value | iv.10 Producer Rent | FDI | FDI net Inflows as % of GDP |
Economic Value | iv.10 Producer Rent | BTF | Barriers to FDI |
Economic Value | iv.10 Producer Rent | EGL | Economic globalization |
Economic Value | iv.10 Producer Rent | DHC | Health Care as % of GDP (dev. fm optimum) |
Economic Value | iv.10 Producer Rent | OFB | Open for Business |
Economic Value | iv.11 Capital Rent | DNI | Neutral interest rate (dev. fm optimum) |
Economic Value | iv.11 Capital Rent | DOI | Inflation (dev. fm optimum) |
Economic Value | iv.11 Capital Rent | CUA | Currency appreciation |
Economic Value | iv.11 Capital Rent | GOL | Gold demand as % of GDP |
Economic Value | iv.11 Capital Rent | DMA | M&A as % of investment (dev. fm optimum) |
Economic Value | iv.12 Labor Rent | UEM | Unemployment rate |
Economic Value | iv.12 Labor Rent | LFP | Labor force participation rate |
Economic Value | iv.12 Labor Rent | WLP | Delta real wage vs labor productivity increases |
Economic Value | iv.12 Labor Rent | LDR | Labor dependency ratio |
Economic Value | iv.12 Labor Rent | YUN | Youth unemployment rate |
Economic Value | iv.12 Labor Rent | GWG | Gender wage gap |
Methodology
EQx is an ongoing research project
In the initial ‘Concept’ phase (2 steps), EQx constructs, architecture and theoretical aspects are developed.
The ‘Input’ phase (4 steps) starts with the collection of the datasets underlying individual EQx Indicators. These are selected on the basis of a theoretical fit and culled from diverse sources. The datasets then undergo methodological transformation, normalization, aggregation and weighting procedures.
The ‘Output’ phase (3 steps) sees the determination of the EQx Country Scores and Global Rank. The final phase includes statistical testing and validation, followed by the publication of results.
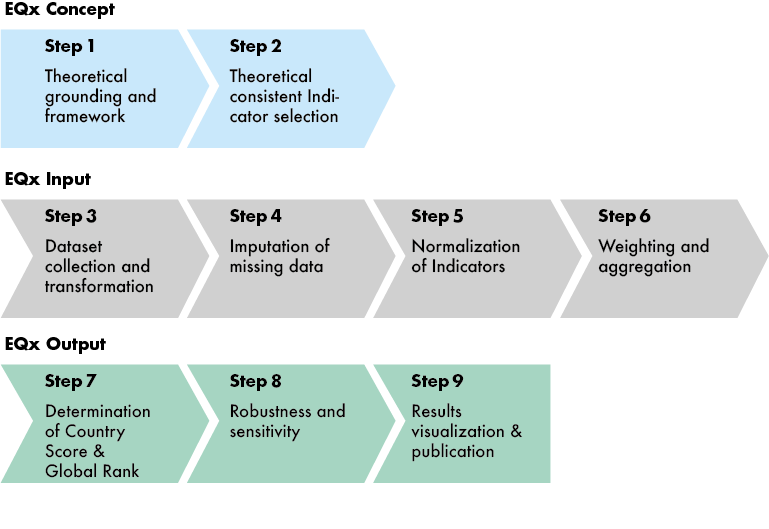
The Elite Quality Index (EQx) applies a methodology grounded in relevant academic literature. EQx’s methodological position is described in the Methodology Paper, available for reference and review by pressing the download button below. Criticism and comments are very welcome.
You can write us at research@elitequality.org