EQx · THE INDEX · FRAMEWORK & METHODOLOGY
A political economy framework
for measuring Sustainable
Value Creation
CONCEPTUAL FRAMEWORK
Elites, Elite Quality, and Value Creation
WHAT
What are elites?
Elites are narrow, coordinated groups that run the largest income-generating business models in an economy. They exist in every society on earth — an empirical inevitability that provides essential coordination and leadership.
Their business models can be located on a continuum that ranges from Value Creation to Value Extraction — the latter representing rent seeking, where "a rent is an unearned reward sought through a quest for monopoly power."
WHY
Why does Elite Quality matter?
The prosperity of a nation depends primarily on whether its elites allocate society's resources to value creation or rent seeking. High-quality elites grow the whole economic pie — increasing wealth for all citizens.
Elite business models are key determinants of economic and human development. The EQx proposes that from a sustainability perspective, Value Creation business models are in the long-term best interest of elites and society alike.
HOW
How do we measure it?
The EQx does not measure elites directly. Instead, it assesses the degree of value creation of their business models through 148 indicators across a four-level architecture: Index → Sub-Indices → Pillars → Indicators.
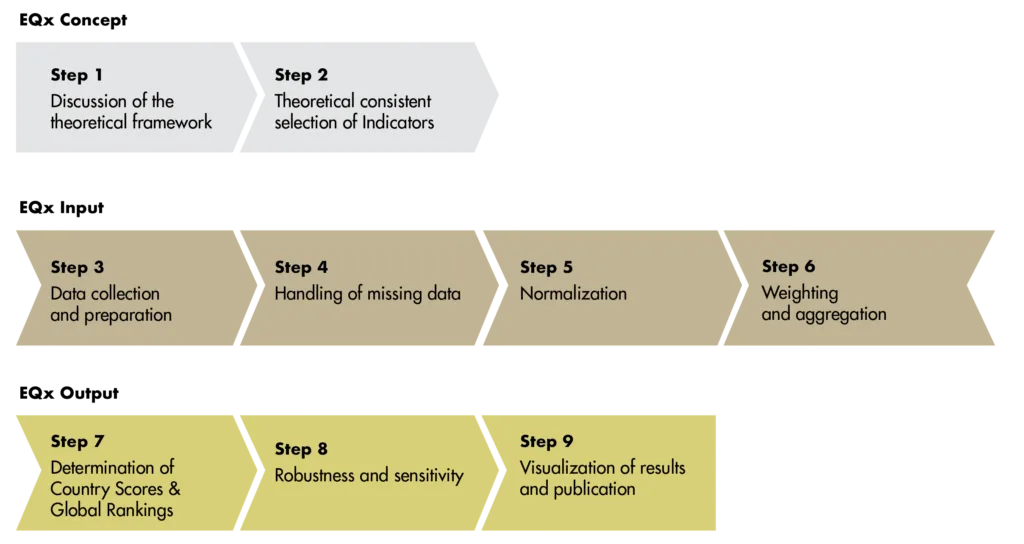
The index follows a 9-step construction process grounded in the OECD Handbook on Constructing Composite Indicators, ensuring full transparency, academic rigour, and statistical validity.
Full methodology →EQx ARCHITECTURE · 4 LEVELS
From concept to country score
The EQx is built on a four-level hierarchy that allows both an overall quantification of a country's Elite Quality and an in-depth analysis of specific political economy dimensions.
LEVEL 1
Elite Quality Index
x1
Country Score & Global Rank. Score from 0 to 100. 100 = highest Elite Quality.
LEVEL 2
Power + Value
x2 + x4
Power (1/3 weight) and Value (2/3 weight). Each contains a Political and Economic dimension — yielding 4 Index Areas.
LEVEL 3
Pillars
x12
3 Pillars per Index Area. Weights determined by Budget Allocation Process with a panel of experts.
LEVEL 4
Indicators
x148
Data from renowned international organisations. Normalised, weighted and aggregated. Most recent data available.
What is Power?
The capacity to enforce one's preferences. Power also has the potential to facilitate Value Extraction — it is a necessary, though insufficient, condition for rent seeking.
What is Value?
The outcome of productive activities. Its creation increases the overall economic pie. High Elite Quality means elites grow the whole pie, not just their own slice.
What is Political?
The dimension where business model rules are determined and Value Creation/Extraction is enabled — the rules of the state, regulation, and human agency.
What is Economic?
The dimension where Value Creation/Extraction is actually implemented via suitable business models — the firm level, industry level, and three markets.
4 INDEX AREAS · 12 PILLARS
The two axes of Elite Quality
Elite Quality is measured across two axes — Power vs. Value and Political vs. Economic — yielding a 2×2 matrix of four Index Areas.
Political Power
Index Area (i) · Power Sub-Index · Weight within EQx: 11.1%
Measures the capture of three kinds of rules: the rules of the state, business regulation, and the rules of human labor. Terminology borrowed from Stigler's 'capture theory'.
State Capture (i.1)
Capture of the state and its government branches — political corruption, press freedom, social mobility, gender parity at state level.
Regulatory Capture (i.2)
Rules and regulations captured by special interests — property rights, crony capitalism, regulatory quality.
Human Capture (i.3)
Restrictions placed on individual freedom — human rights index, gender equality, LGBT+ inclusiveness, modern slavery.
Economic Power
Index Area (ii) · Power Sub-Index · Weight within EQx: 22.2%
Measures elite dominance in the economy: at the coalition level, at the individual firm level, and in terms of competitive renewal via creative destruction.
Coalition Dominance (ii.1)
Power of diverse coalitions — unionisation rates, public employees, criminal actors, military expenses, economic complexity.
Firm Dominance (ii.2)
Power concentrated in leading firms — top 10 market cap as % of GDP, billionaires' wealth, SMEs per 1,000 people.
Creative Destruction (ii.3)
Pressures for renewal and disruption — entrepreneurship, venture capital, firm exit ratio, AI investment per capita.
Political Value
Index Area (iii) · Value Sub-Index · Weight within EQx: 22.2%
Measures Value Creation and Extraction in the political dimension through the perspective of income — how the state takes, gives, and earns income.
Giving Income (iii.1)
How government uses public finances — subsidies and transfers as % of expenses, public education, healthcare provision.
Taking Income (iii.2)
Rent extraction as state collects income — corporate tax rate, fiscal decentralisation, cybersecurity index, homicide rate.
Unearned Income (iii.3)
Exploitation of natural resources or future generations — natural resource rents as % of GDP, government debt as % of GDP.
Economic Value
Index Area (iv) · Value Sub-Index · Weight within EQx: 44.4%
Measures Value Creation and Extraction from the economy's three markets: products and services, the capital markets, and the labor markets. Highest weight in the EQx.
Producer Value (iv.1)
Value created or rents extracted by producers — R&D intensity, innovation, entrepreneurship, market competition.
Capital Value (iv.2)
Value created or rents extracted in financial markets — capital expenditure intensity, FDI, sustainable project financing.
Labor Value (iv.3)
Value created or rents extracted in labor markets — unemployment rate, youth unemployment, brain drain index.
METHODOLOGY · 9-STEP CONSTRUCTION PROCESS
How the EQx is built
The EQx follows the OECD Handbook on Constructing Composite Indicators, ensuring transparency, academic rigour and full reproducibility. The full methodology is documented in a dedicated page.
01
Theoretical framework
Elite theory of economic development. Value Creation vs. Value Extraction as the core analytical lens.
02
Indicator selection
Theoretically consistent selection of 148 indicators aligned with the EQx conceptual framework.
03
Data collection & preparation
Data from renowned international organisations. EQx2026 uses primarily 2025 data. Extensive data cleaning and repurposing.
04
Handling of missing data
Approach avoids systematic bias. Missing data does not penalise or favour any country — it solely influences score accuracy.
05
Normalisation
Z-scores → rescaled to 0–100. 100 = highest Elite Quality. Outlier winsorisation at [–2, +2]. Log transformation for 17 indicators.
06
Weighting & aggregation
Sub-Indices: conceptual deliberation (1/3 Power · 2/3 Value). Pillars & indicators: Budget Allocation Process with expert panel.
07
Country Scores & Global Rankings
Linear aggregation scheme with full compensability between elements at each aggregation level.
08
Robustness & sensitivity
Statistical assessment published in peer-reviewed journal Social Indicator Research (Diebold, 2022).
09
Visualisation & publication
Annual report. 151 country scorecards. Interactive data tools. Open datasets (PEQx) for researchers.
148 INDICATORS · PREVIEW
What we measure and why
Each of the 148 EQx indicators provides evidence of Value Creation or Value Extraction in the political economy. The full explorable table is filterable by Index Area, Pillar, and indicator name.
Showing 10 of 148 indicators. Full explorable table coming soon.
HISTORY · EDITIONS
Six years of Elite Quality measurement
The EQx has been published annually since 2020, continuously expanding its coverage of countries, indicators and analytical depth.
EQx2026
7th edition · 151 countries · 148 indicators
EQx2025
6th edition · 151 countries · 148 indicators · AI indicators added
EQx2024
5th edition · 151 countries · 142 indicators
EQx2023
4th edition · 151 countries · 130 indicators
EQx2022
3rd edition · 131 countries · 120 indicators
PEQx2021
2nd edition · 120 countries · 105 indicators
PEQx2020
1st edition · 100 countries · 95 indicators